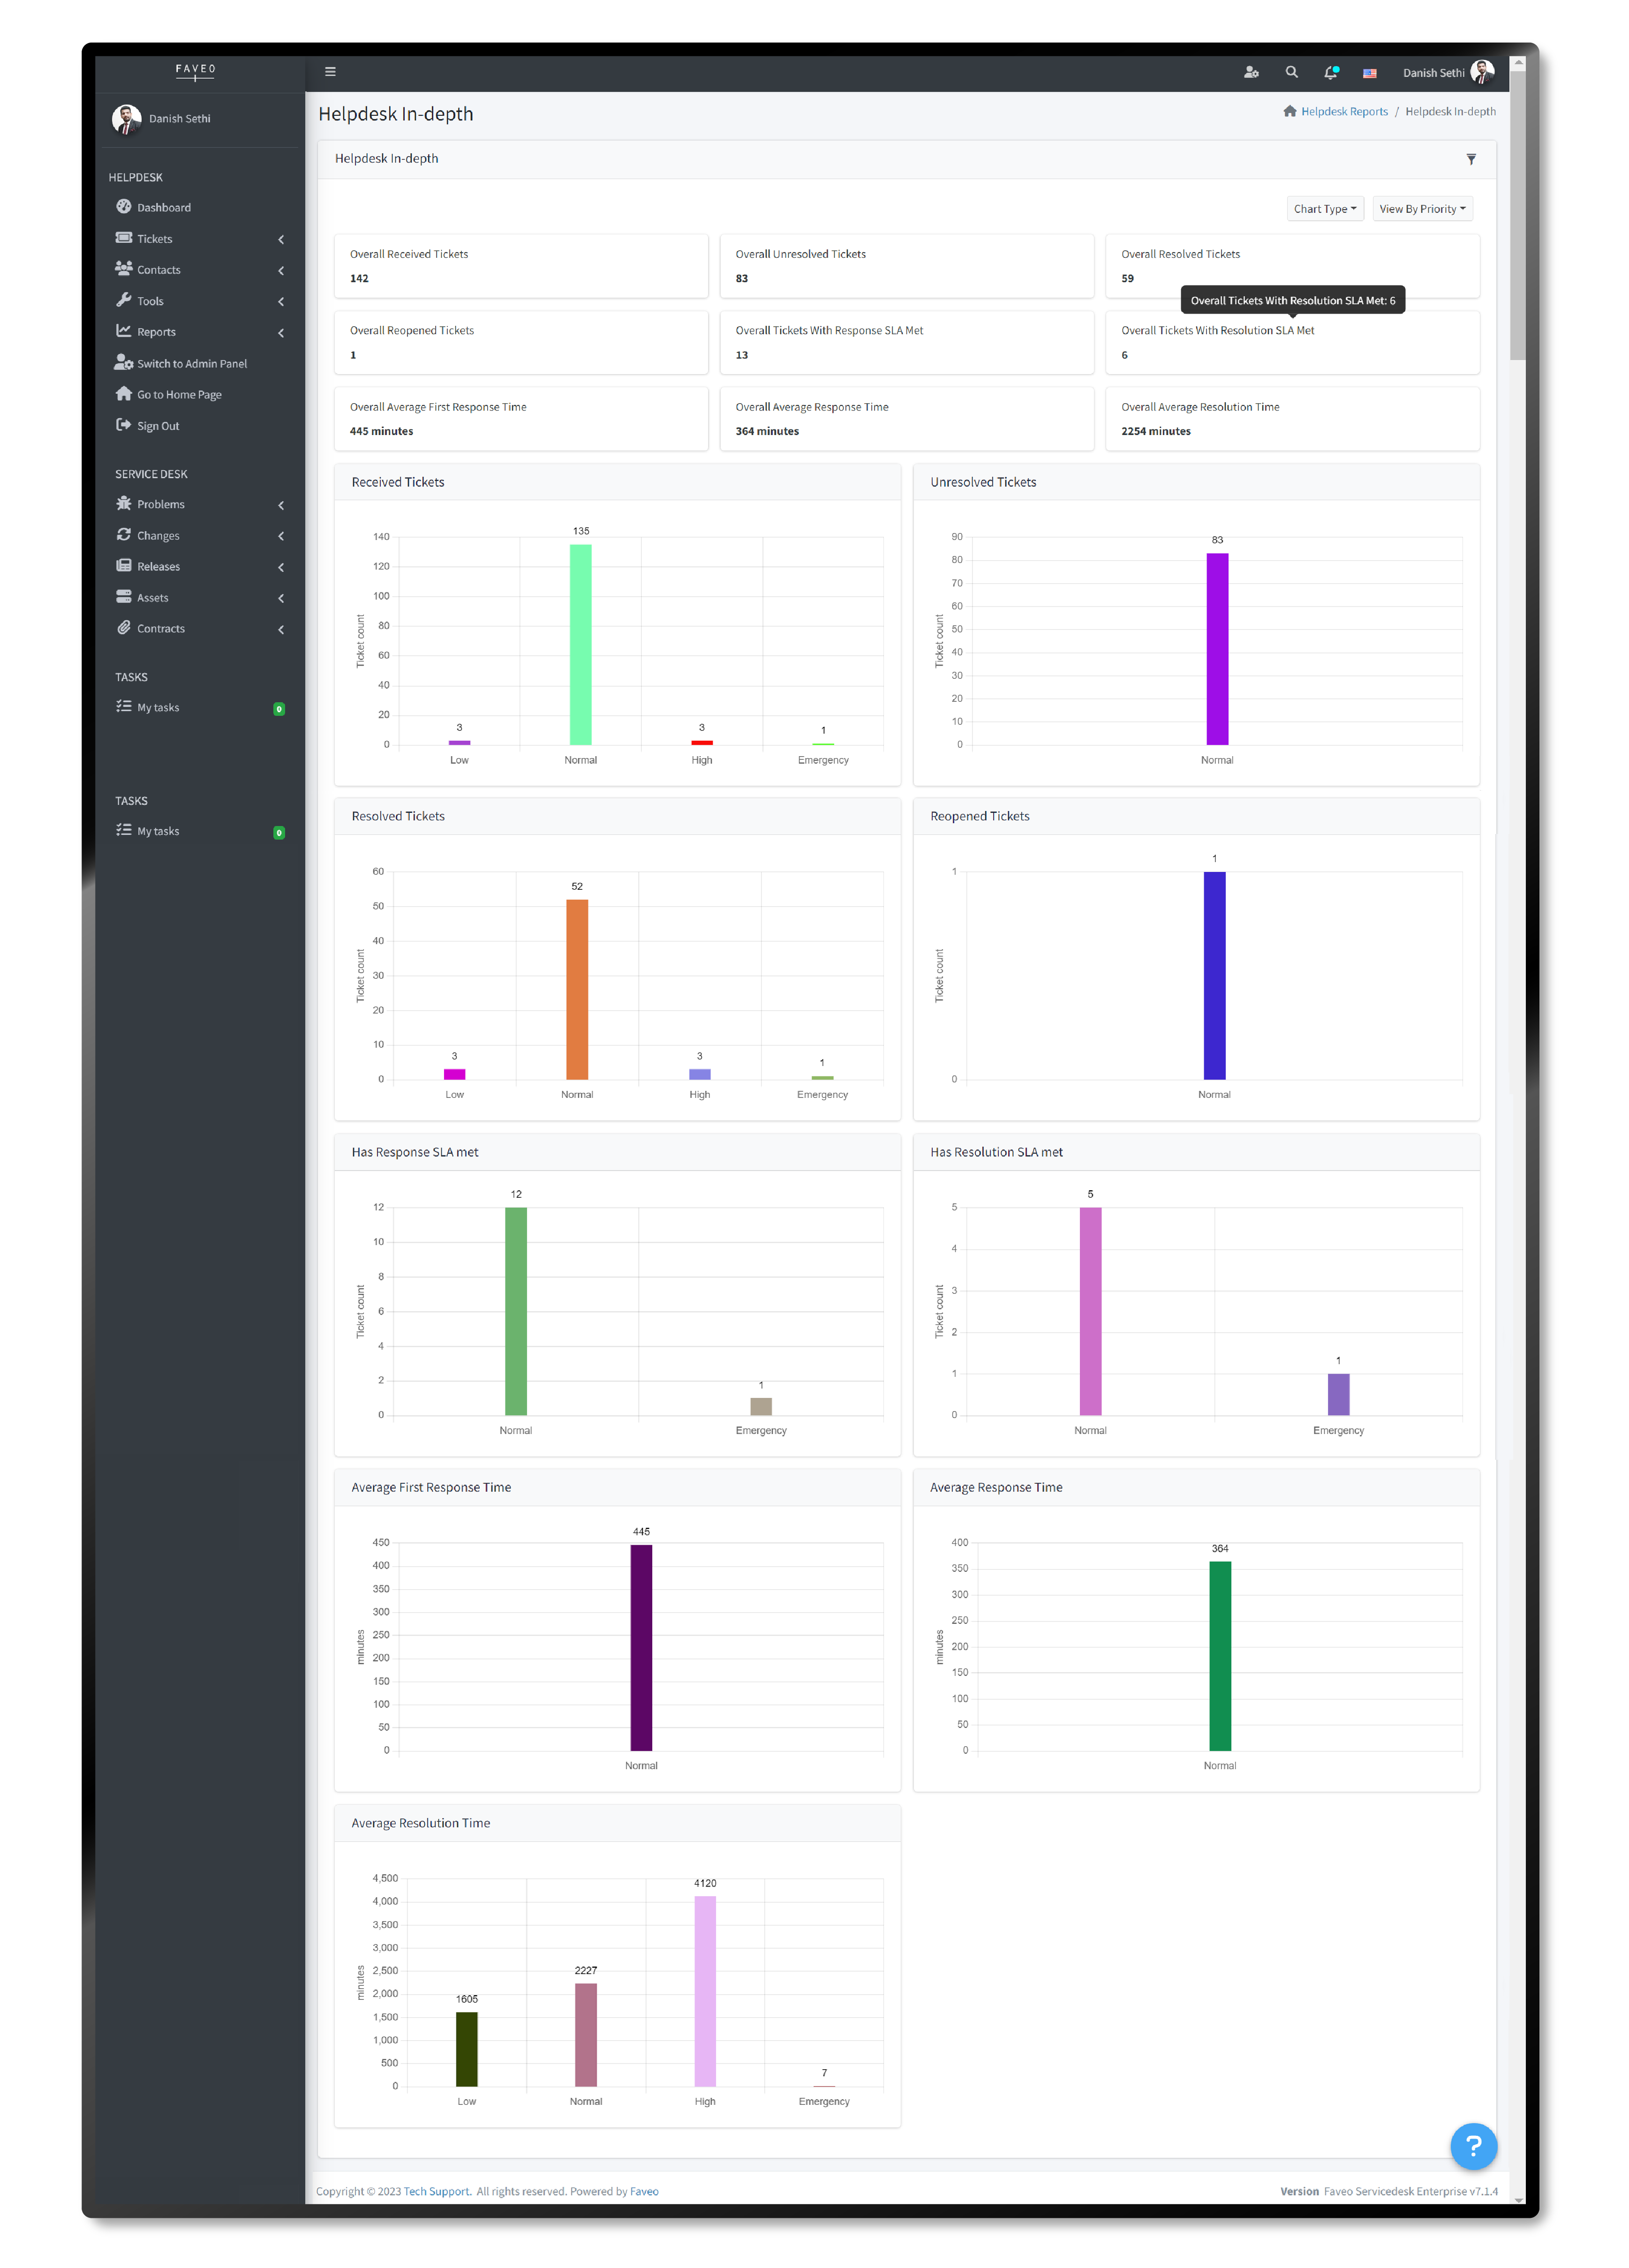
Faveo helpdesk in-depth report gives you an overall summary of the tickets in the helpdesk system which are received, resolved, unresolved, reopened, etc. Helpdesk In-depth report displays the properties of the tickets created within the specified time period. You can sort the helpdesk in-depth report based on various metrics applied on the report page.
Faveo Support system extends this functionality by presenting the report data in different chart types, allowing users to choose the format that best suits their needs, such as Bar, Horizontal Bar, Pie or Doughnut charts. Moreover, users can also view the helpdesk in-depth report based on different categories like view by status, view by priority, view by source and view by type.
Help desk in-depth Report filters have various kinds of properties using which you can filter the report and view the chart based on the filters. If you want to get even more specific with your report, you can use filters. Filters are like special tools that let you pick exactly what you want to see. You can click on the Filter button in the top right corner of the report, and it will help you choose what information you’re interested in. If you want to filter the helpdesk in-depth report by using custom fields, you can make use of “Add custom filter” and select the ticket custom properties from the list with which you want to filter. With this feature, users can select ticket custom properties from a list, narrowing down the report results to precisely match their requirements.


