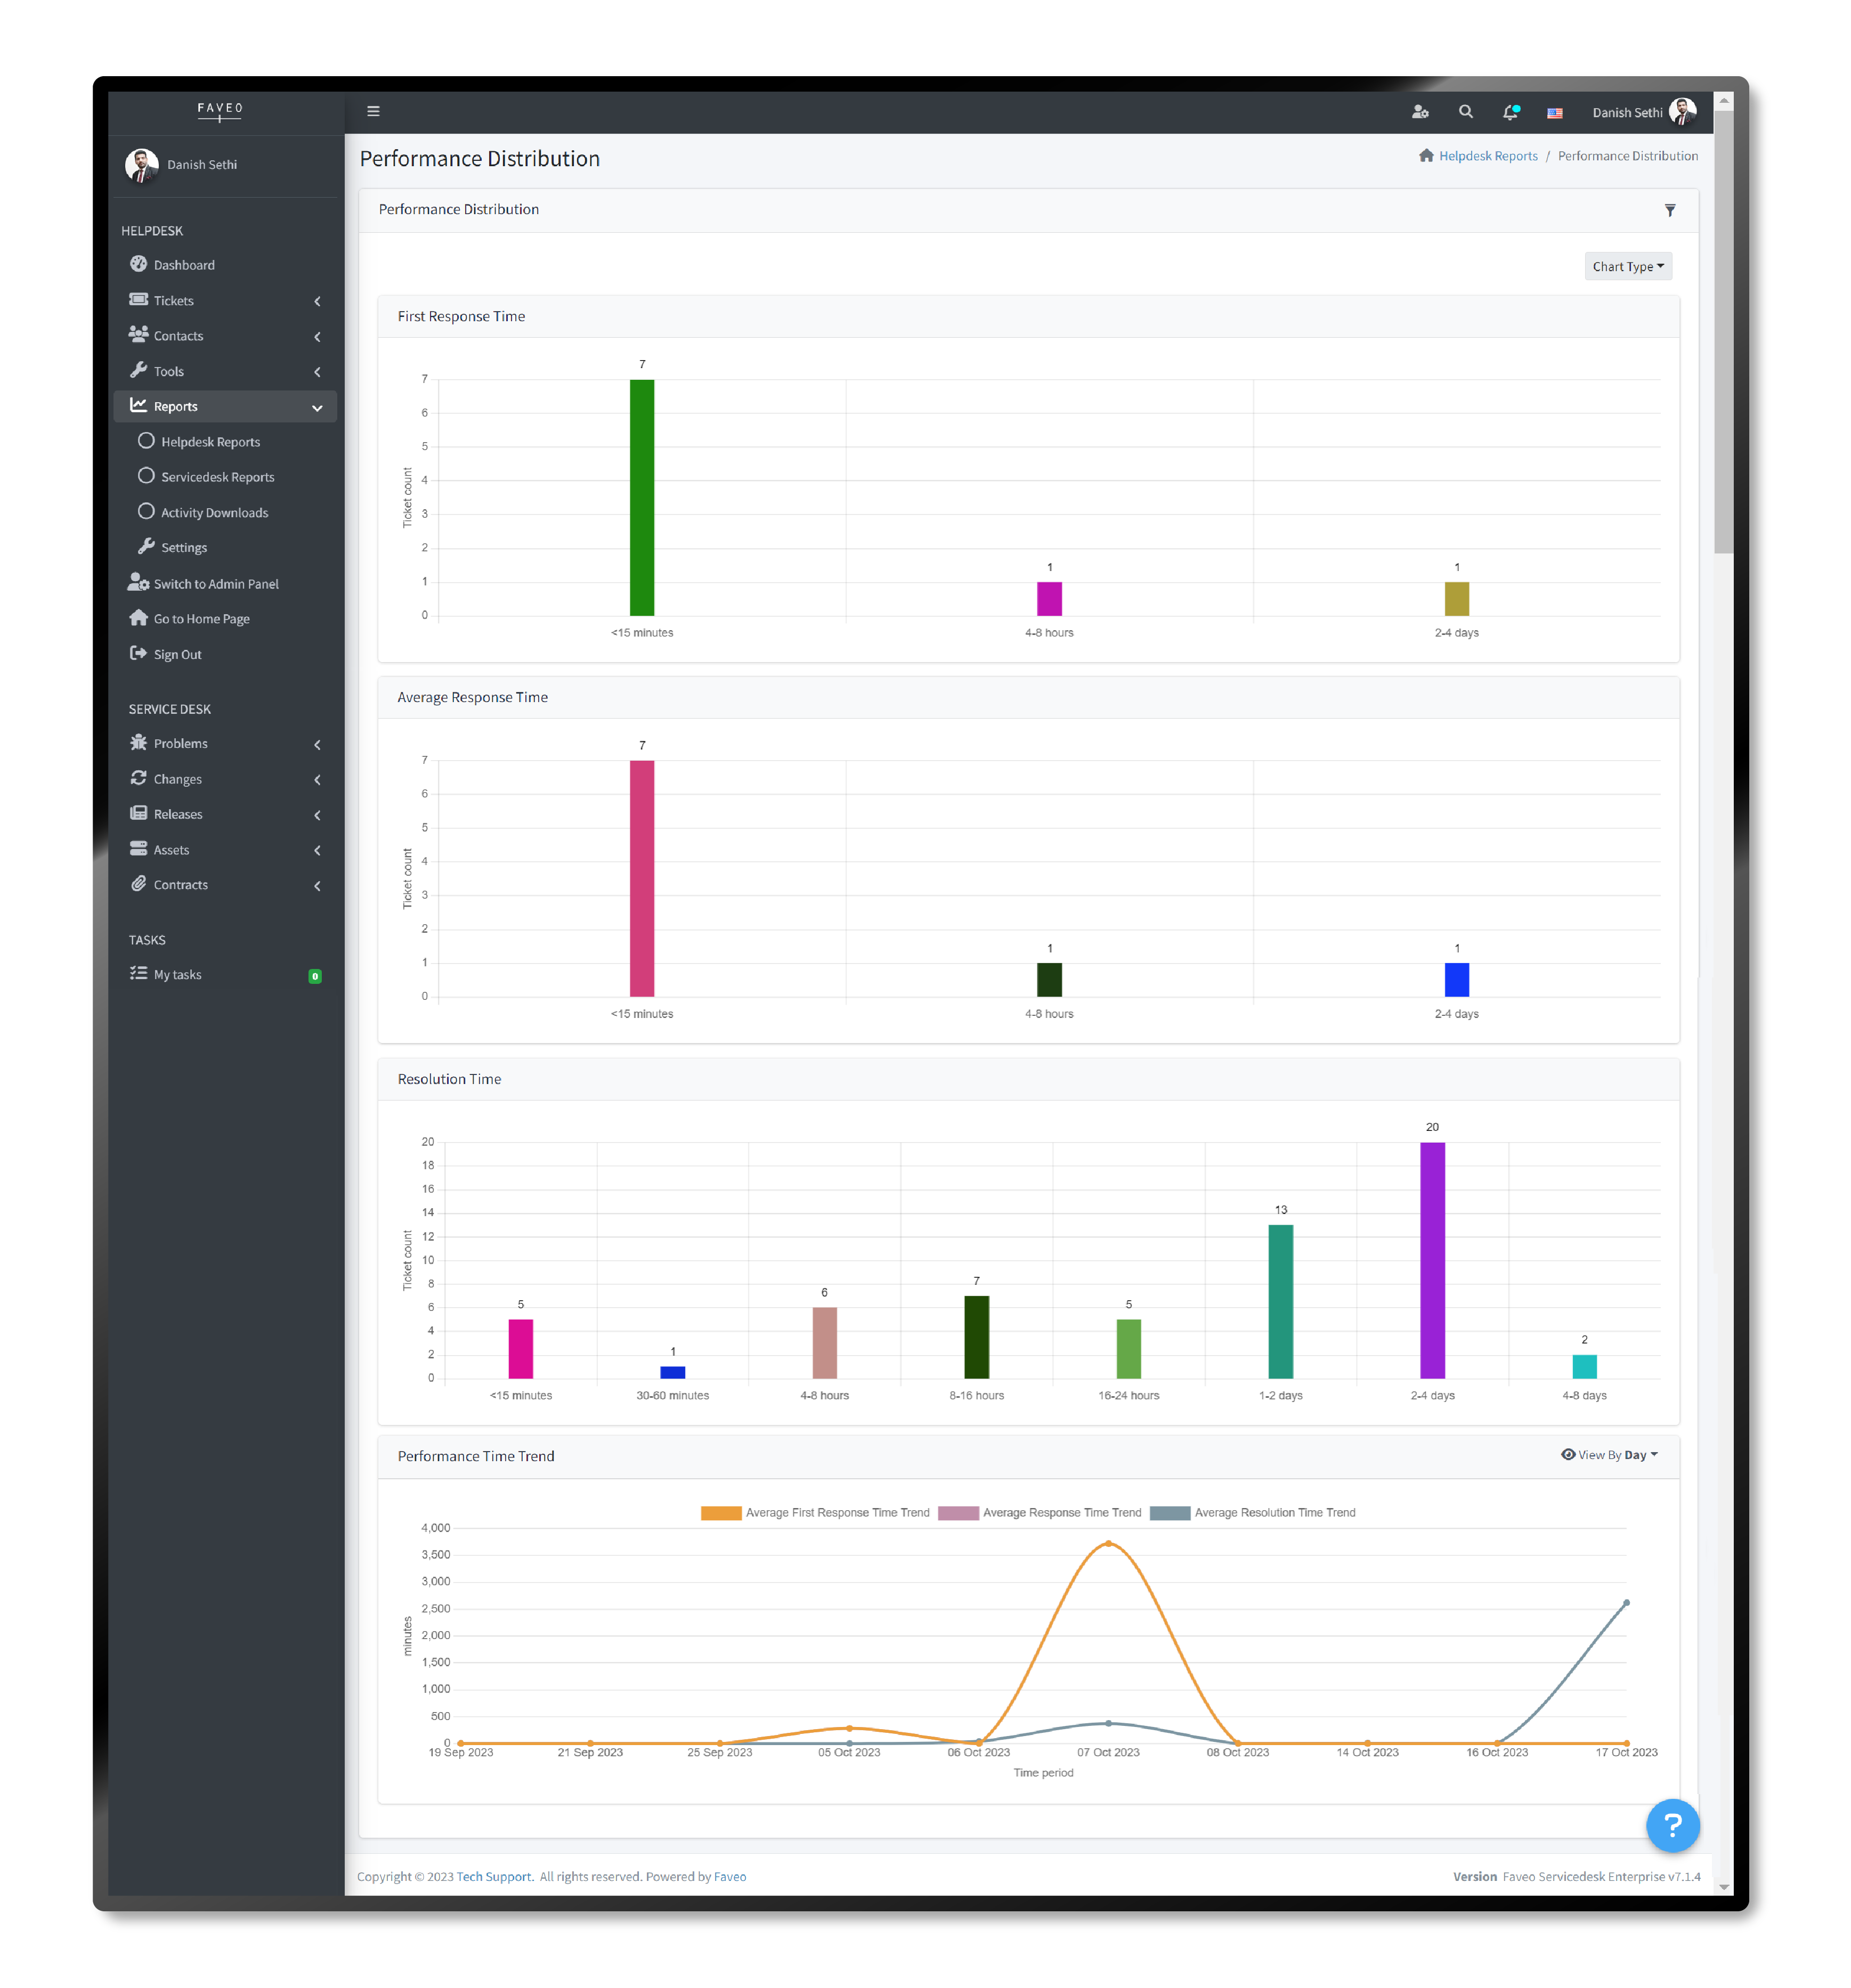
The performance distribution graphs focus on the agent and group performance metrics, including first response time, average response time, and resolution time. These metrics are calculated based on the specific business hours associated with each ticket.
In Faveo, it calculates the time and displays the report for three key areas
- First Response Time on Tickets
- Average Response Time on Tickets
- Resolution Time on Tickets
The Performance Time Trend Chart showcases the report on the time taken for First Response, Average Response Time, and Resolution Time. You have the flexibility to view this chart in various formats, including daily, weekly, monthly or yearly.
Performance Distribution Report filters have various kinds of properties using which you can filter the report and view the chart based on the filters. These filters include attributes such as Subject, Ticket ID, Requester, Organization, Department, Help Topic and more. Additionally, you can add custom fields by selecting the “Add Custom Field” option. If you desire to apply custom filters for the performance distribution report, you can do so by using the “Add Custom Filter” feature. This allows you to select specific ticket custom properties from a list, enter your criteria, and then click “Apply” to filter and access the report.


