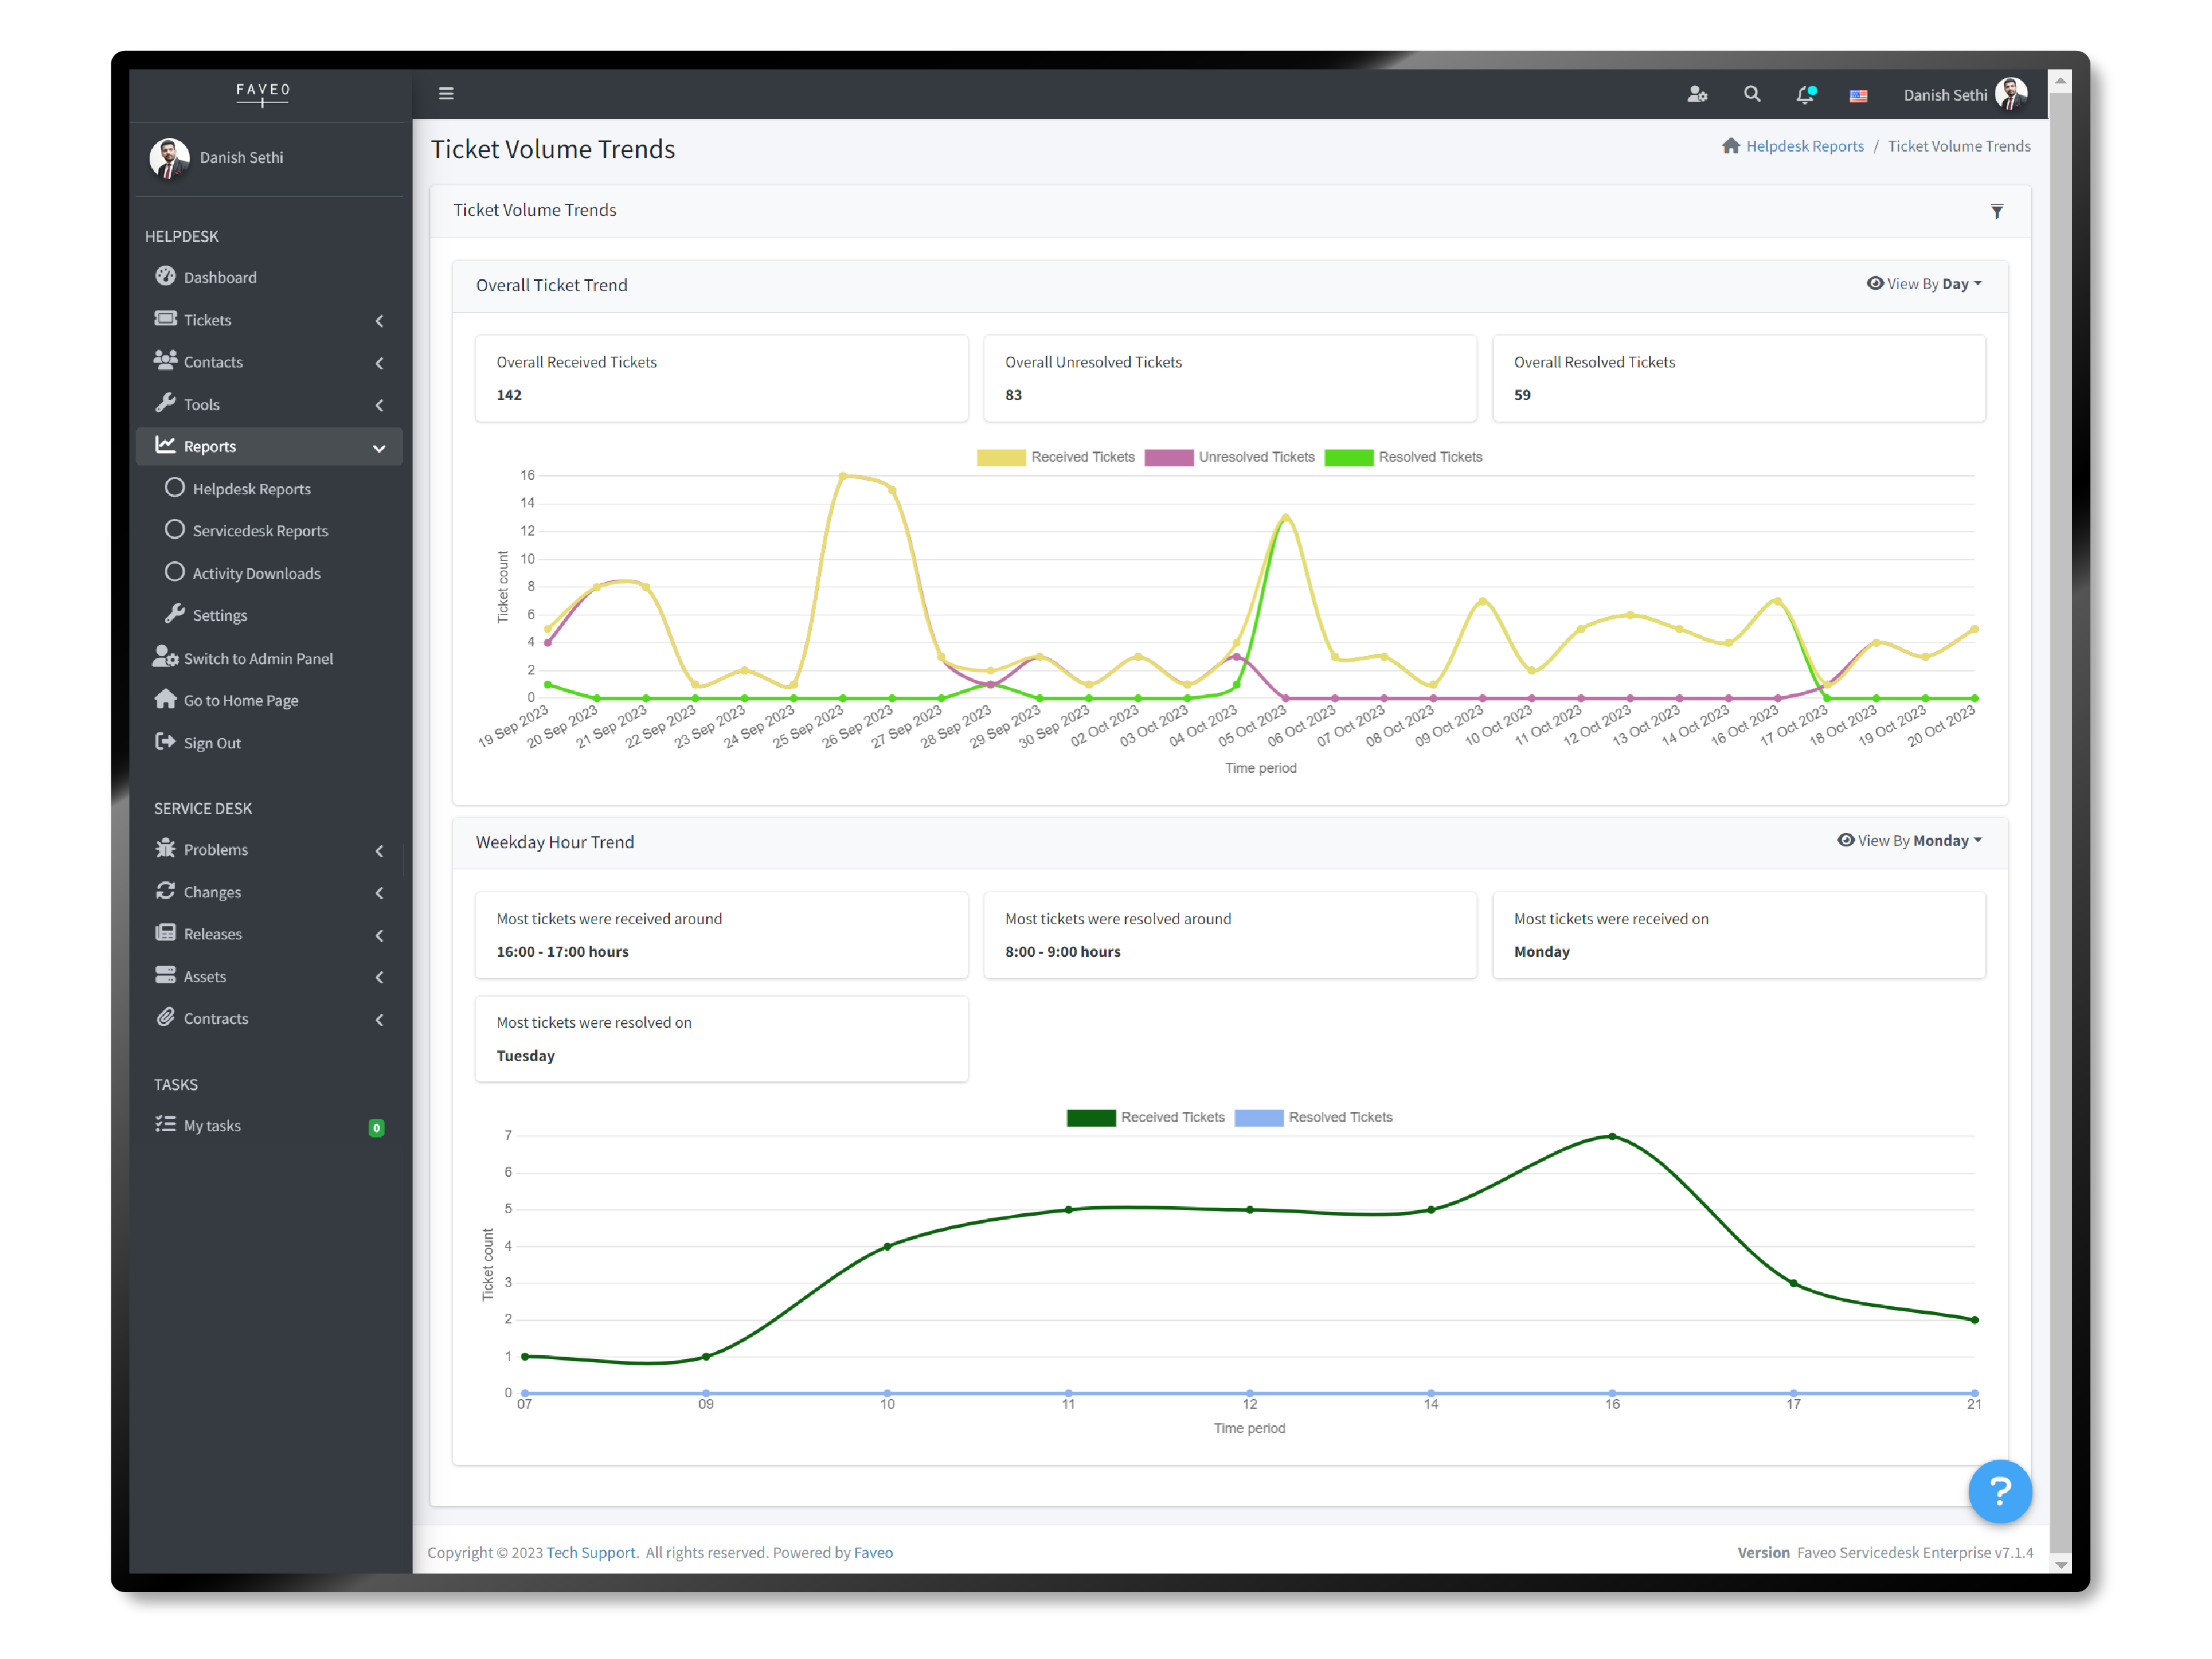
Within the Ticket Volume Trends report, you’ll find graphs illustrating Tickets Overall Received, Resolved and Unresolved. These reports serve to provide insights into the flow of tickets within your helpdesk ticketing system and help you allocate resources accordingly.
When you wish to view the ticket creation details on a daily or weekly basis, the Ticket Volume Trends report becomes a valuable feature. It presents data on which days, weeks, months or years experience the highest ticket volumes, including received, unresolved and resolved tickets. Additionally, this report displays the actual ticket counts for the specified time frame and helps you understand the ticket flow in your support system in two different formats overall ticket trends and weekly hour trends.
If you wish to filter the Ticket Volume Trends report using custom fields, you can utilize the “Add Custom Filter” option. This feature allows you to select specific ticket custom properties from a list, which you can then use for filtering. After entering your filter criteria, click “Apply” to refine and view the report based on your selected parameters.
When analyzing weekly trends, you have the flexibility to view the report based on specific days of the week, such as Monday, Tuesday, Wednesday, Thursday, Friday, or Saturday. The Ticket Volume Trends Report filters encompass various filter properties, allowing you to tailor the report and view the resulting chart. You can select the “View by Report” option in different formats, including day, week, month or year.


